Are you willing to guess?

↓
I came across a riveting math text this morning that had me feeling awful:
We consider constructing a machine to learn f(x) from being presented with various examples of x and f(x).
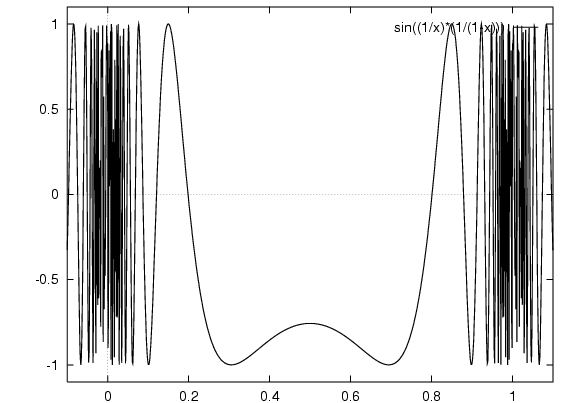
We do not see an equation for the function. We do not see a graph like above. All we see are exemplars of x and f(x). The machine discovers that f has this shape through learning.
It is told (or discovers) that f(4.3) = 0.2305,
and f(4.1) = 0.2415.
So it guesses that f(4.2) = 0.2360.
Almost spot on - it's actually 0.2358.
But then it finds out that f(0.3) = - 0.19,
and f(0.1) = - 0.54.
So it guesses that f(0.2) = - 0.365.
However, this is totally wrong. In fact, f(0.2) = - 0.95.
And what is f(0.15)? The machine might now guess f(0.15) = - 0.745.
But it is wrong again. In fact, f(0.15) is not even negative. It is 0.37.
My goodness, did you feel that?!
The zigs, the zags. The poor thing thought it was learning something, and then BAM, it's totally wrong. And so it tries to learn again and BAM, it's wrong again!
Oof.
The devilish secret (tee hee), is that the graph looks something like this:
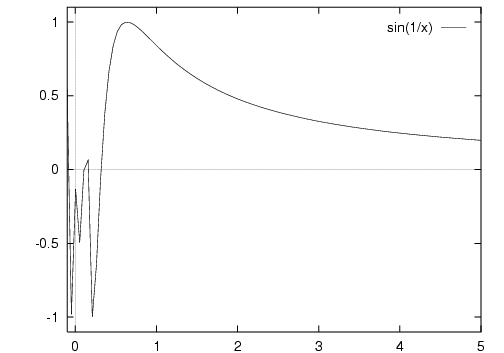
That's okay though, a few zigs and zags! If you're rooting for our little WALL-e to figure this out: he's got a chance!
But then we amp up the resolution and discover it looks like this:
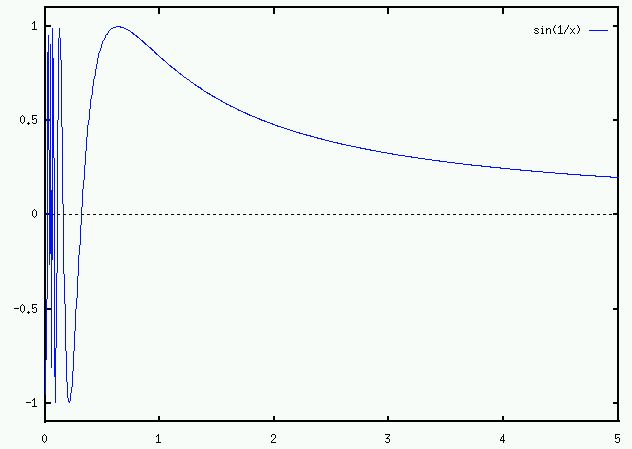
Hmph. Fine, it's weird! Not quite what we expected, but, that's ok. If I'm the machine and I need to learn this, I can probably figure it out still. I have nearly unlimited resources as a computational engine after all.
So it doubles down and keeps trying to figure out that wild space between 0 and 1, and it keeps being wrong, because the really naughty secret is it looks something like this:
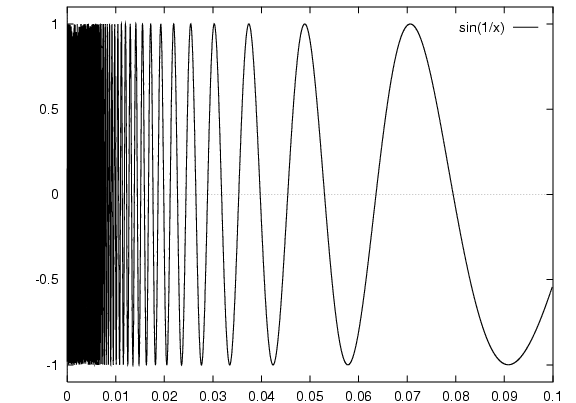
Paging Dr Malcolm
When you invest in economics courses, you're taught to think of markets in terms of supply and demand curves. They're ... simple:
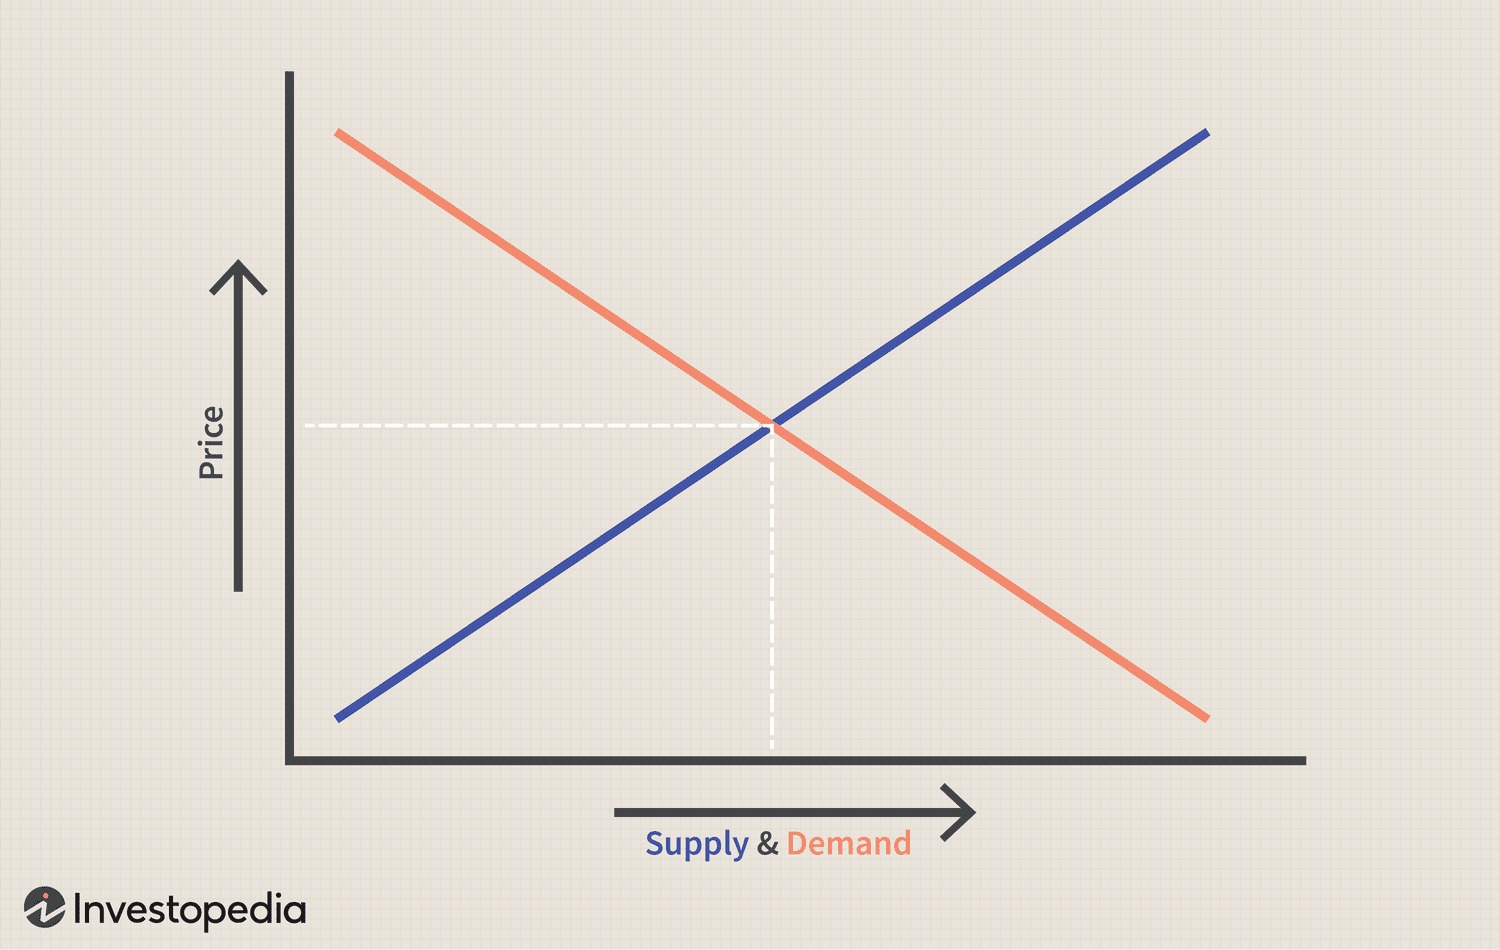
These are the kinds of drawings upper-level managers of mature companies in mature markets fret about in board rooms.
But founders enter markets before supply — and sometimes before demand. Like our ill-fated WALL-e machine above, we start with a canvas and some evidence and attempt to learn the shape of the market by playing with inputs we control: pains to solve, problems at the root of those pains, pricing levels, messaging, who we're selling to, how it's bundled, what features it has.
So we test. We slap $49/mo, $99/mo, $149/mo on a pricing page. And we observe: 'oh, see?! The fewest people buy the $149/mo plan! That supply and demand curve strikes again! And it's so accurate — the correlation is tight!'
We're exploring the market the way a toddler explores the Atlantic ocean: just as far as we're comfortable.
But what would happen if you raised that top price from $149/mo to $500/mo? Would demand really continue to crater? Is it possible it would go up? Would the early adopters in the mid-market start to take it seriously and ask you for deeper integrations and features?
I mean, maybe your market is shaped like this:
Bullets and Butterfly Wings
If we're before fit and we want to find the shape of our market, we have to stop thinking linearly and be willing to take shots into the spaces that we think are empty.
At Summit, I was certain we had to drive adoption bottoms-up, so we began with a free tier and upgrades for $24/mo. We focused on tooling. We targeted end users, low-code builders.
Fit ended up being a platform made for the team those builders were embedded in and sold to the VP that manages that team. We learned this because I (finally) reached out to a few C-level execs at growth-stage companies and listened to how they described the problem we were solving, and heard the value from their perspective. Suddenly, a tops-down, higher-ticket opportunity appeared.
At Riskpulse (now Everstream), we sold weather-tracking software as a B2B SaaS. One year, with revenue in a plateau, we added a few illustrations to our marketing site. One of them was a stretch of highway colored red, orange, and green to represent the weather risk of traveling that corridor cross-country. Two months later I was talking to a logistics manager at a F500: "We just lost two million dollars worth of merchandise. Can you guys actually do that?" Enterprise fit.
In both cases, no one would have blamed me for concluding that those spaces were empty; we had no data to suggest opportunities existed in those voids, and what data we did have implied that those spaces were (very) fruitless.
But those spaces were only vacant from our vantage point.
Our future customers were there all along, waiting.